Volunteering statistics: The most likely volunteers in the UK
The Department for Digital, Culture, Media and Sport recently conducted a survey to reveal the volunteer rates in the UK and how they compared to previous years. The volunteering statistics revealed some interesting information about who’s donating their time, who isn’t and the current trends in volunteering.
Volunteering Statistics, Rates & Trends
Levels are stable
The UK volunteering statistics found that there haven’t been any significant changes in the percentage of people volunteering.
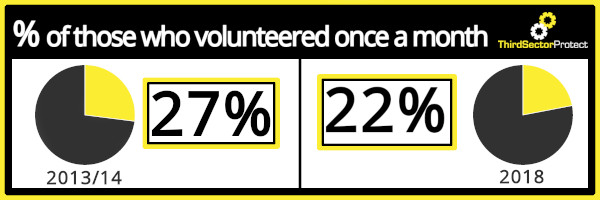
38% of people surveyed said they had volunteered at least once between 2017-2018 which is a 1% increase from the previous year. Whilst this is a positive result, the percentage of those formally volunteering once a month has decreased from 27% in 2013-2014 down to 22% in 2018.
65-74-year old’s are the most frequent volunteers
29% of 65-74-year old’s volunteer once a month, with 42% volunteering once a year. Unfortunately, the previous rise of young volunteers aged between 16-24 have slowed to match the rest of the population.
The least likely group to volunteer were 25-34-year old’s.
This coincides with the time the age groups have spare, also revealed by the study, which showed that those who didn’t work were more likely to volunteer regularly.
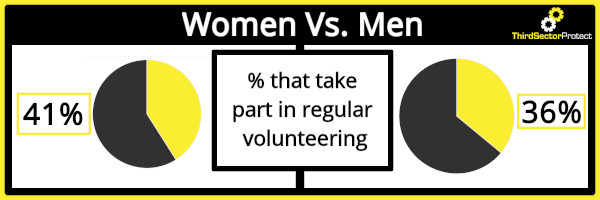
Women vs. men
Women were found to be more likely to have taken part in regular volunteering than men, with 41% having volunteered monthly at some stage, compared to 36% of men.
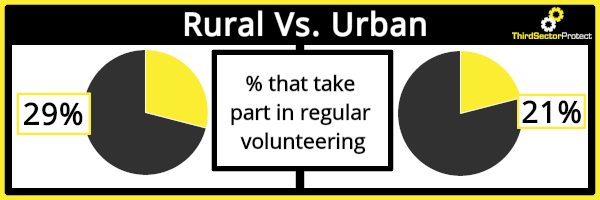
Volunteering is rife in affluent, rural areas
Volunteering statistics revealed that those living in deprived, urban areas were less likely to formally volunteer. Between the years of 2017-2018, 15% of those living in the most deprived areas of England volunteered regularly, whilst in the least deprived areas, this increased to 29%. When comparing rural to urban areas overall, we see that 29% regularly volunteer in rural areas, compared to 21% in urban areas.
‘Doing good’ is a volunteer’s most likely motivation
The top three motivations listed in order are:
- I wanted to improve things/help people – 46%
- The cause was important to me – 31%
- I had spare time to do it – 25%
Whereas the least common motivations for volunteering were:
- I felt there was no-one else to do it – 7%
- It helps me get on in my career – 7%
- It gives me a chance to get a recognised qualification – 2%

ThirdSectorProtect
Volunteer rates can vary over time but if you run a charity, you will understand the motivations behind volunteers and the benefits that their support can bring. But did you know that you might need employers’ liability insurance for your volunteers?
Depending on your charity, your volunteers might be covered with your public liability insurance but that isn’t always the case.
If you’re unsure whether you need additional cover, call us on 0800 877 8277 for a no obligation review of your existing insurance policy.
Why not check out these other useful articles?
- Guide to employing & insuring volunteers.
- How to recruit and manage volunteers in your organisation.
- Volunteering Law- Explained
- Barriers to volunteering: how to get potential volunteers over the hurdle
For more tips and tricks on all things related to charities, not-for-profits and community groups, follow us on Facebook, Twitter & LinkedIn.
 |  |  |  |